Overview
Between the onset of the pandemic in March 2020 and the Fall of 2022, third-party food delivery platforms experienced a significant increase in orders for meals and groceries. Doordash alone, one of the most popular food delivery companies in the US, saw its revenues increase 33% between September 2021 and September 2022.
Research
In the Spring of 2022, my colleagues Gregory Simon, Ph.D., and Hillary Quarles, Doctoral Candidate, created a series of surveys designed to look at the impacts of the expanding Last-Mile Food Delivery (e.g., DoorDash, UberEats, Postmates, etc.) landscape in Denver, CO. They surveyed across three categories: Delivery Couriers, Customers, and Restaurant Owners.
The following slide decks are visualizations of survey responses. This initial survey has since given rise to a more comprehensive survey, with research ongoing as of March 2025. The intent is to publish findings in the near future.
Survey Categories
Three distinct survey populations were analyzed:
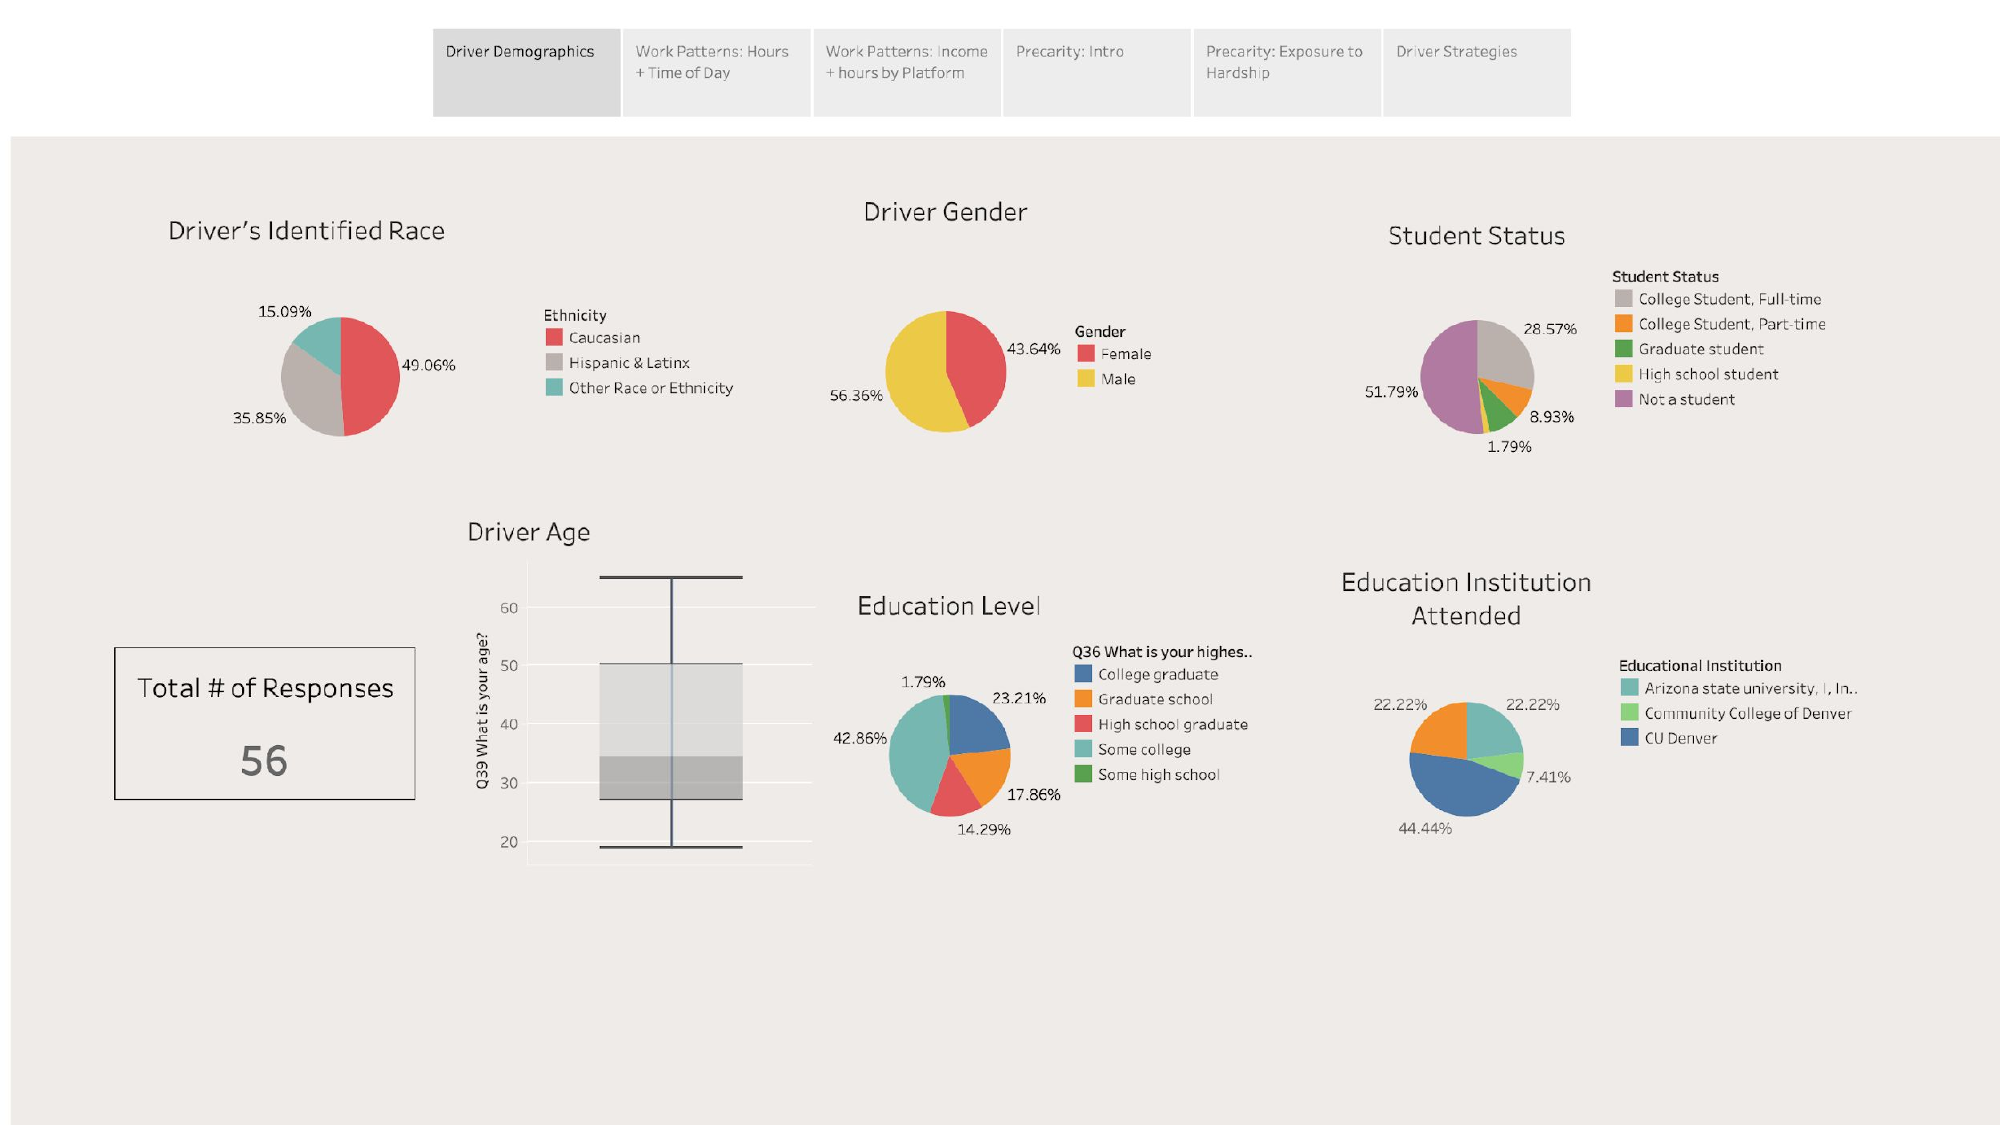
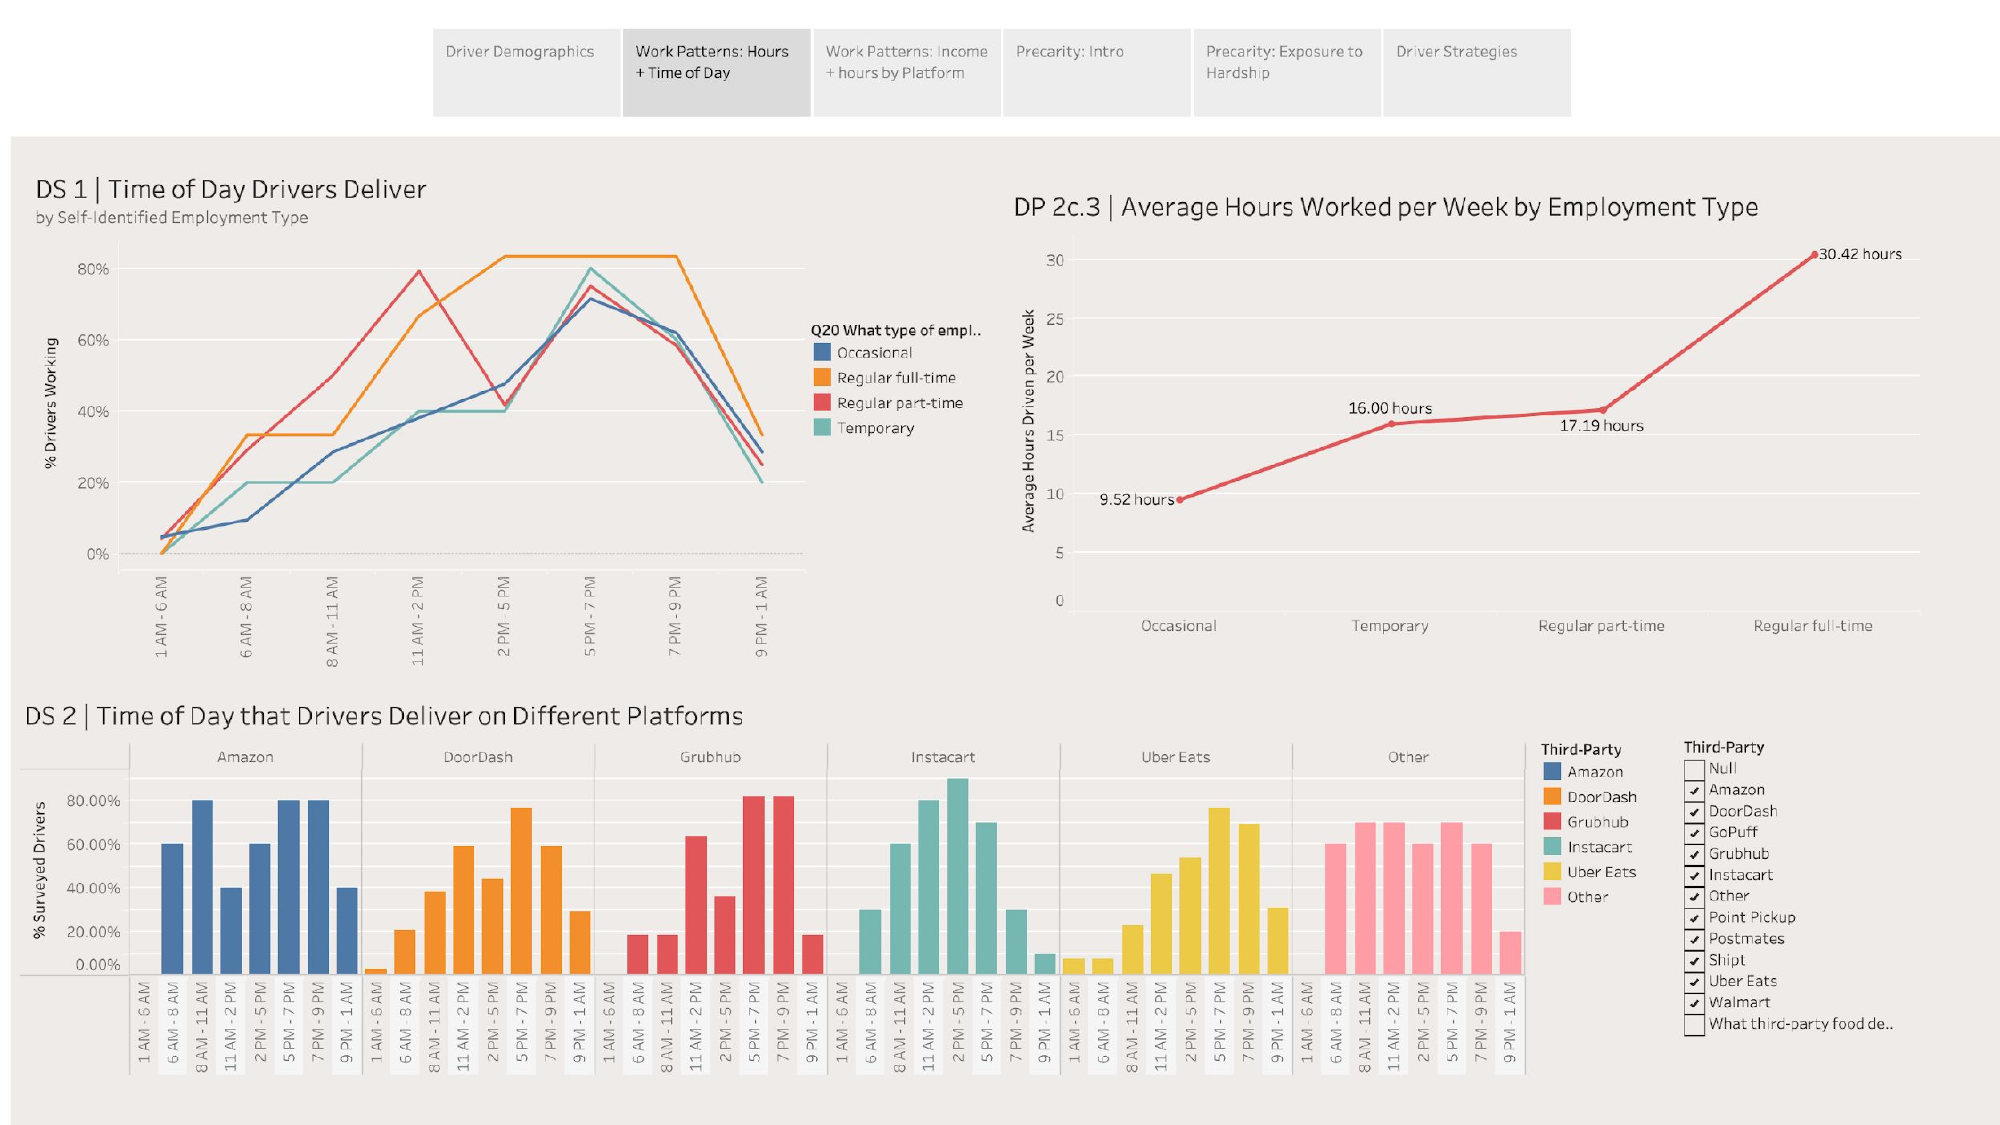
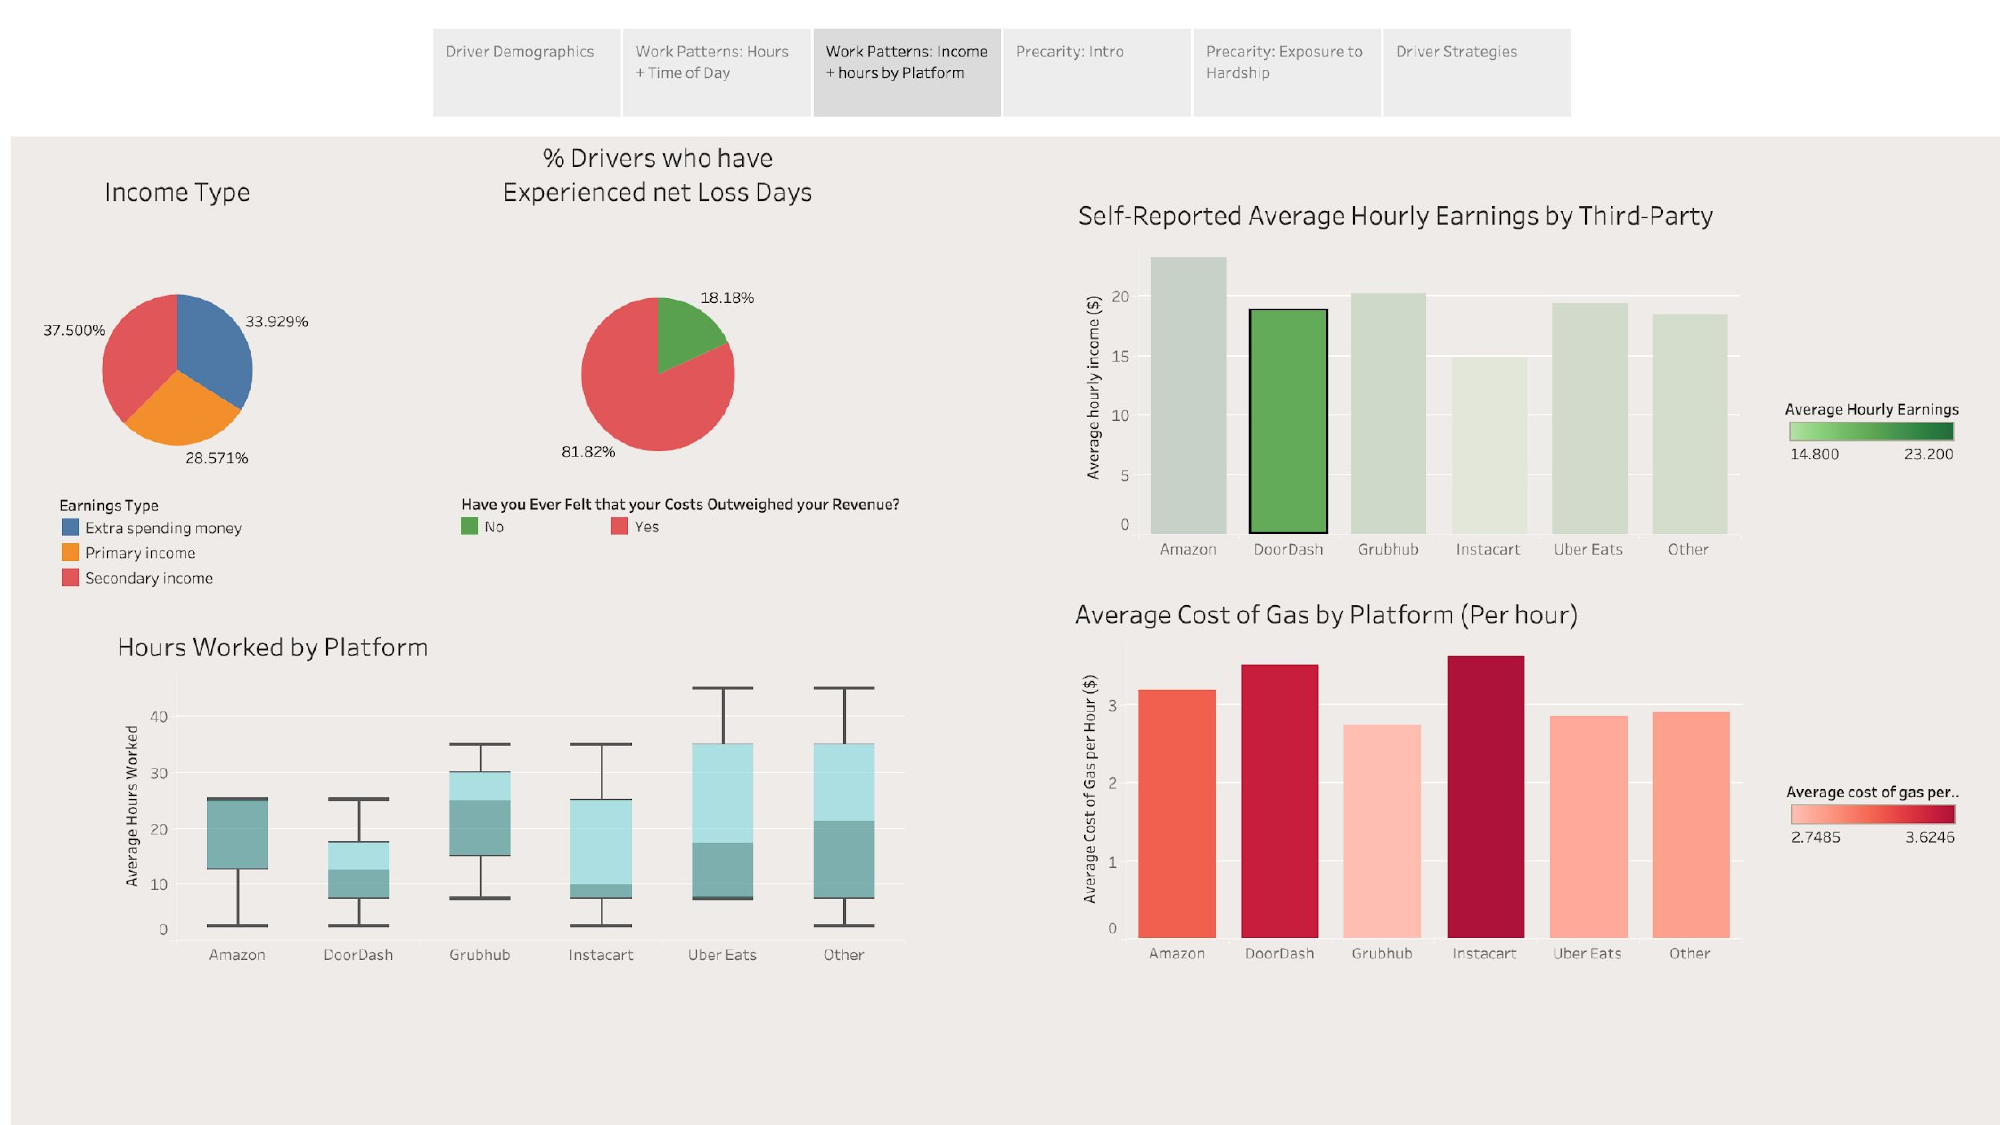
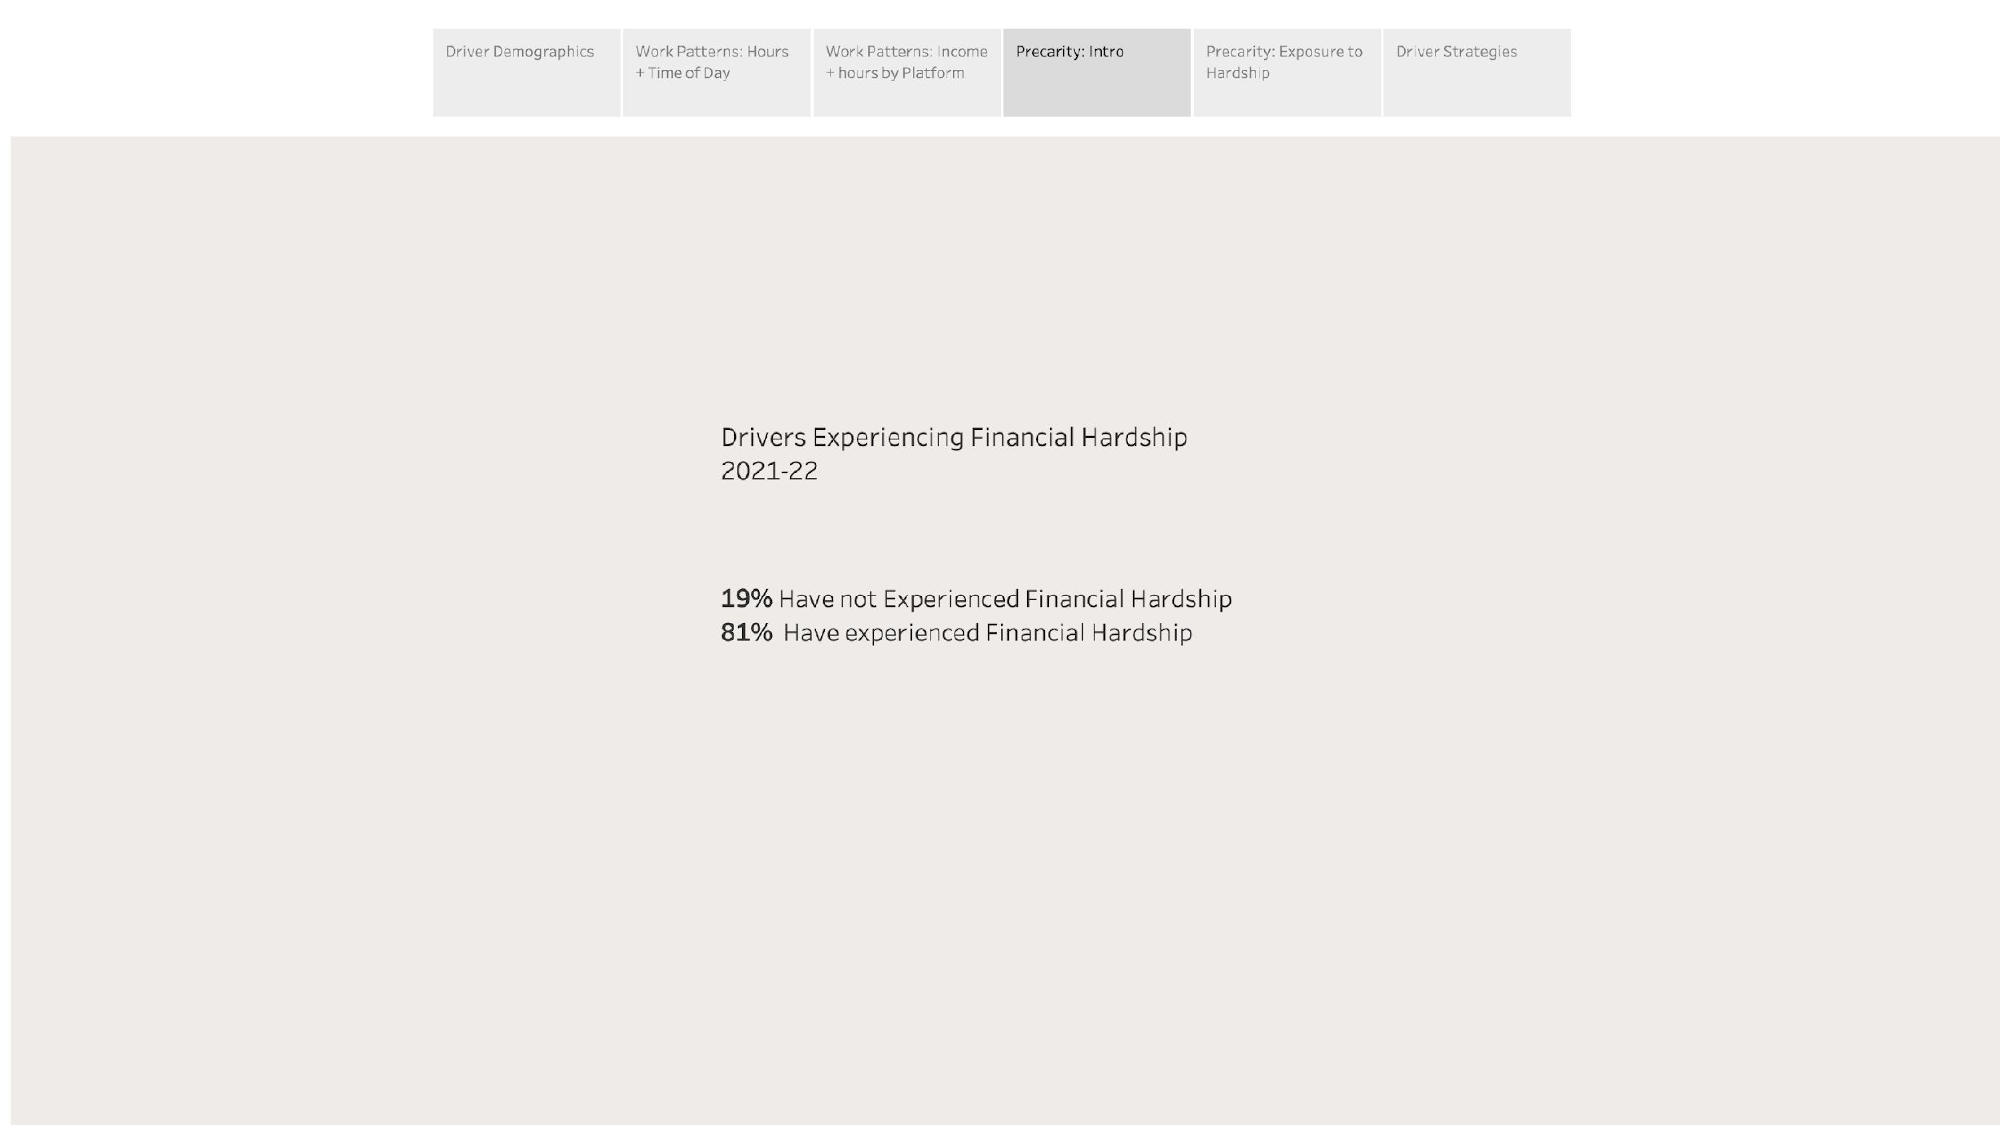
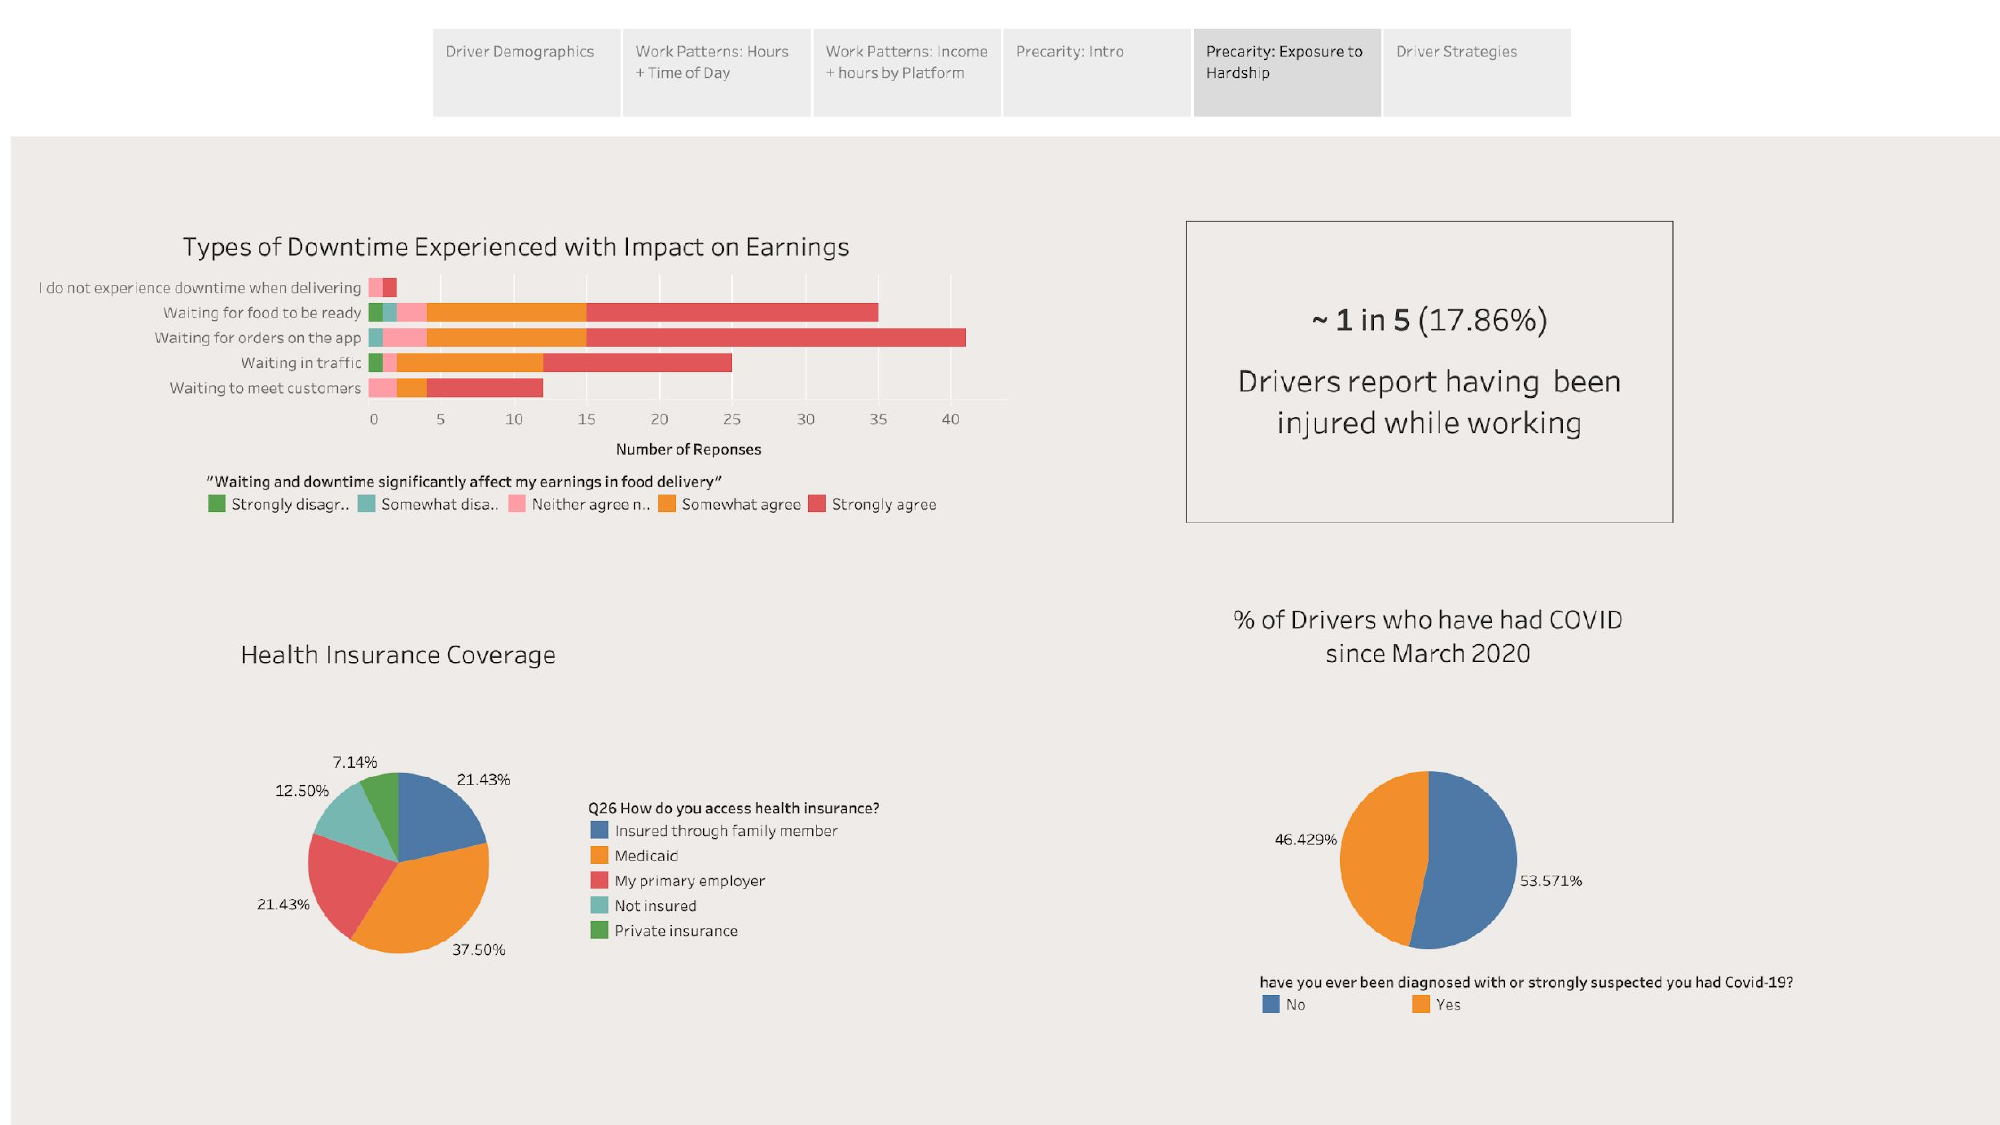
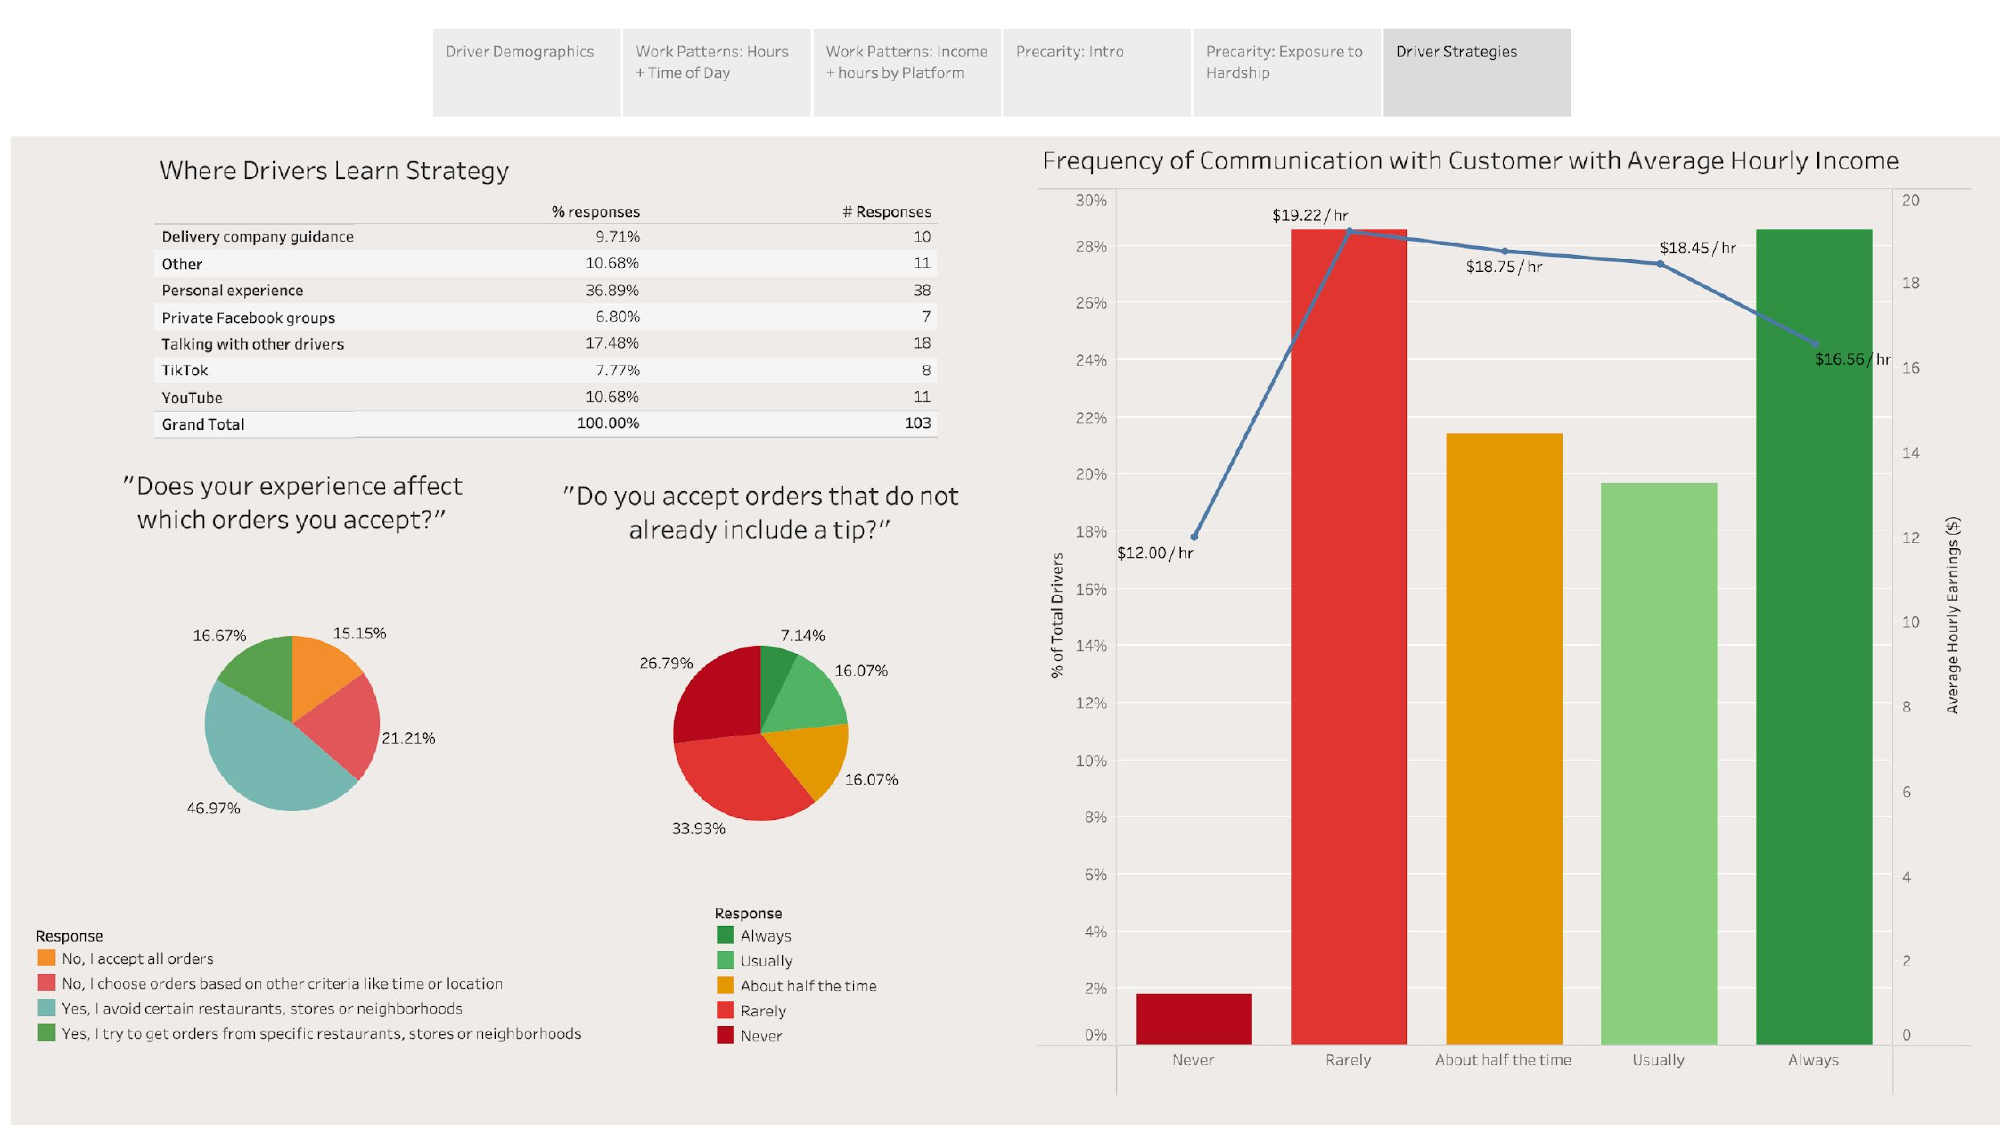
- Courier Survey - Perspectives from delivery drivers
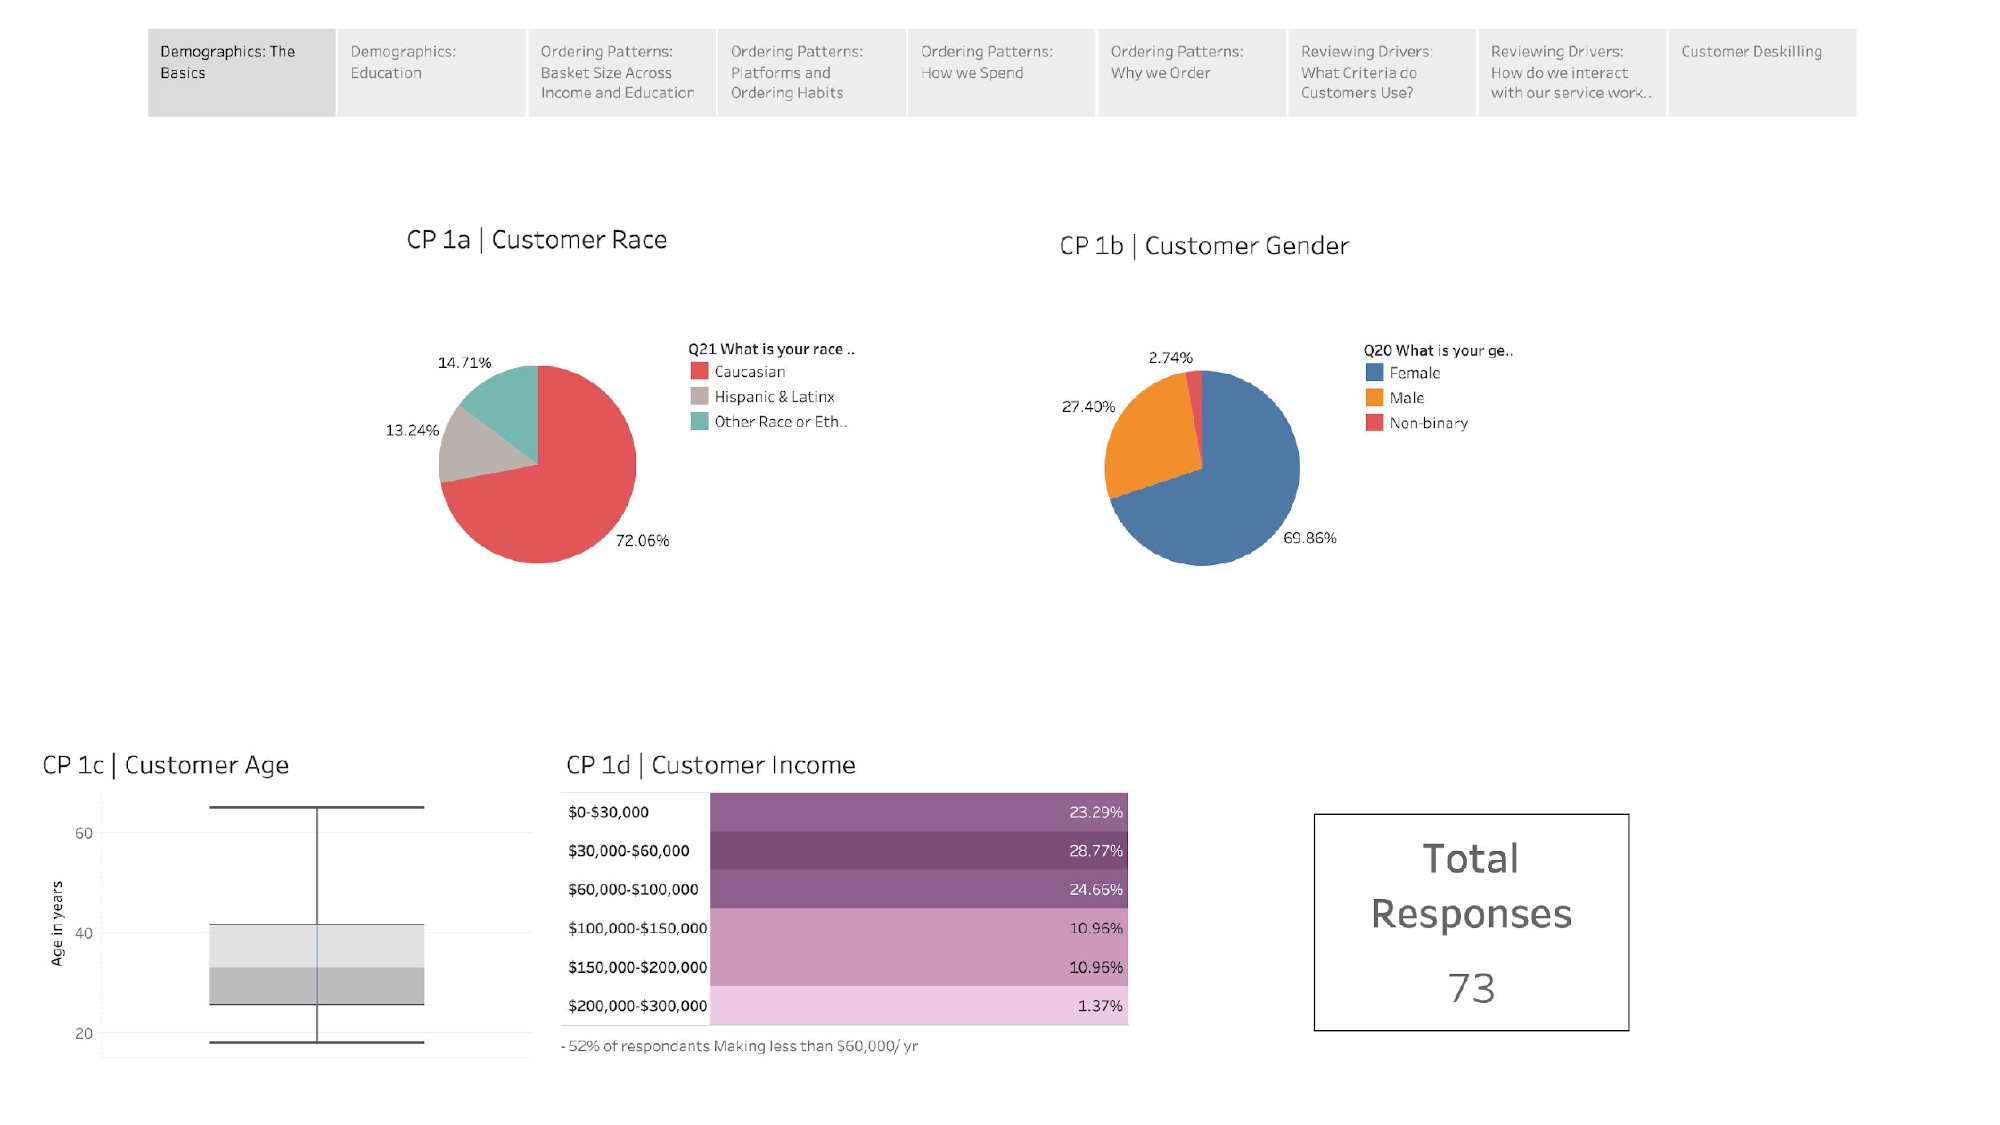
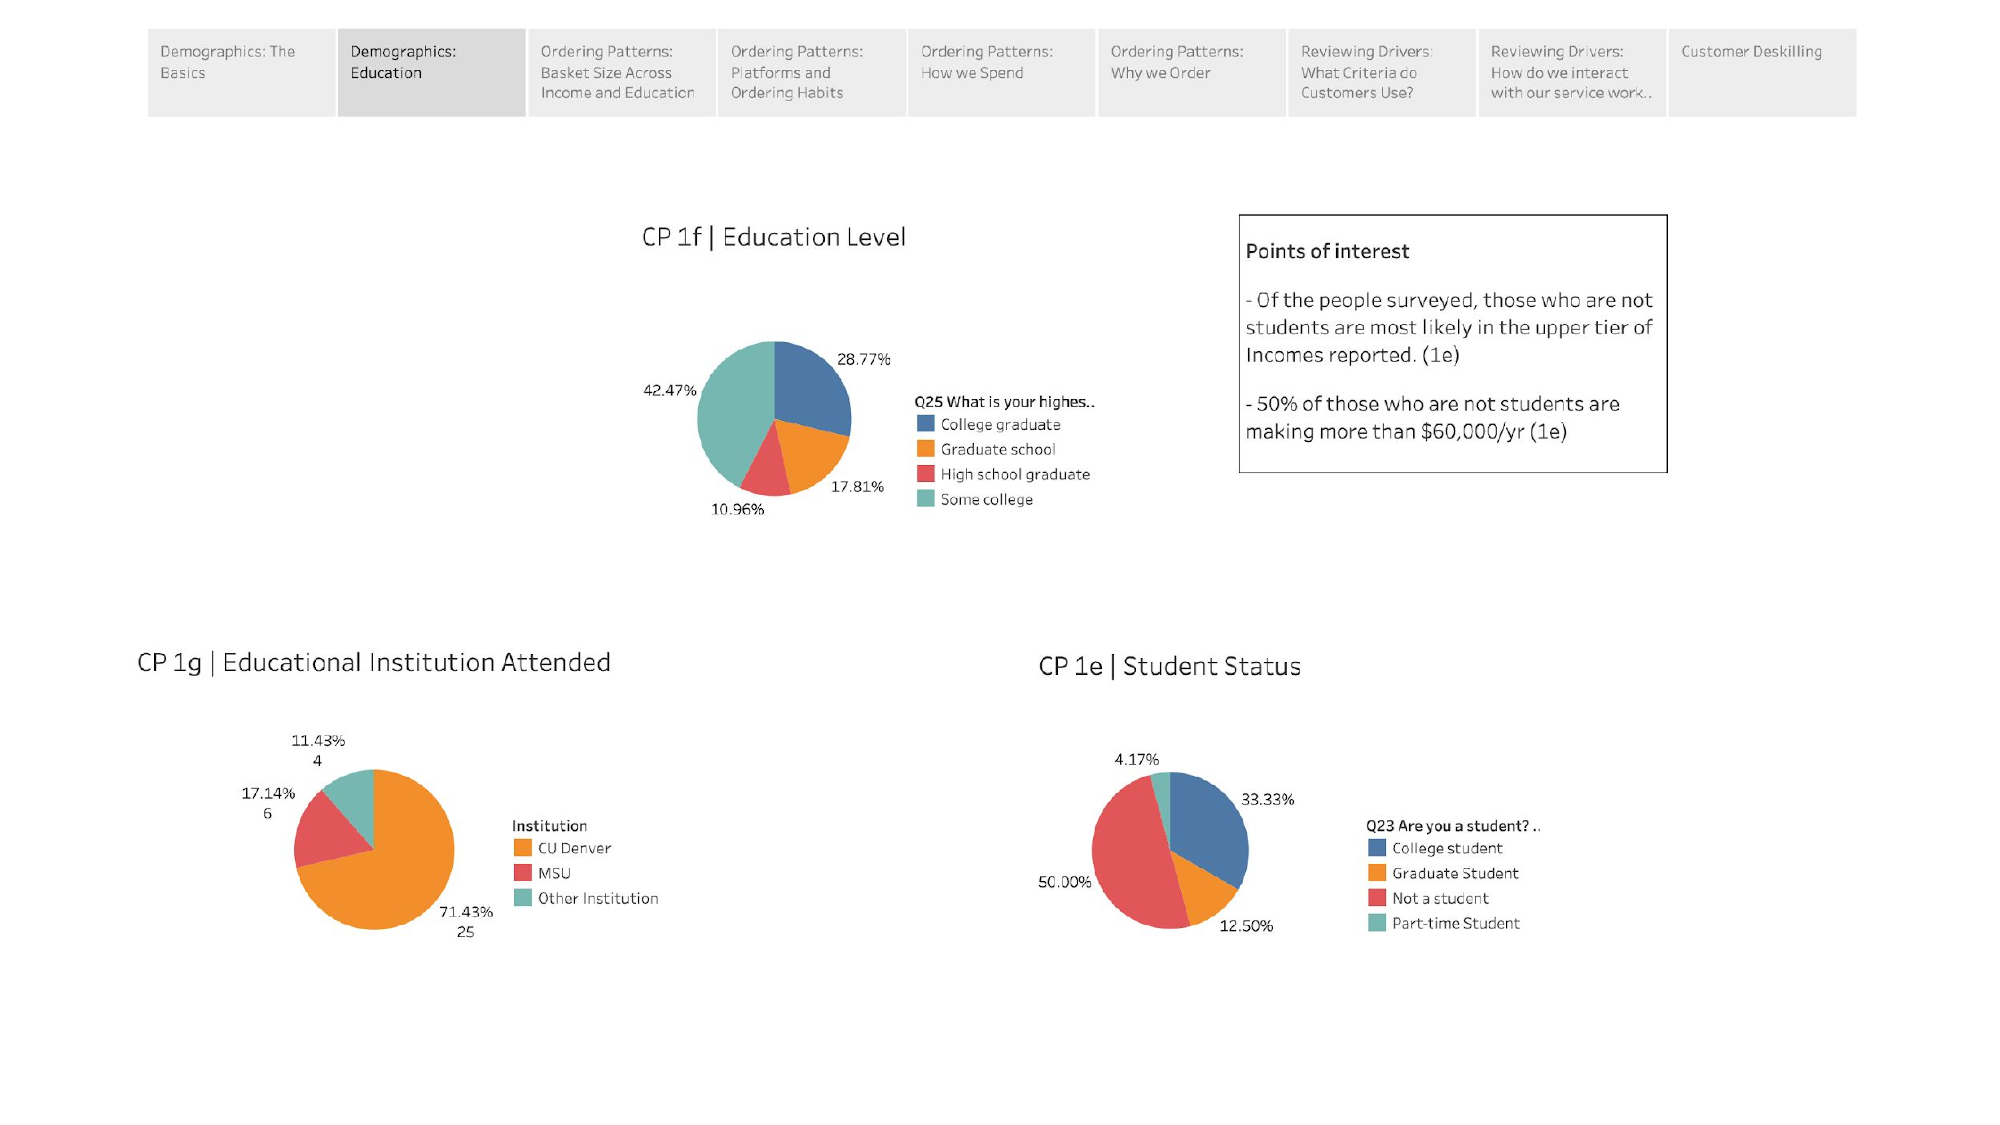
- Customer Survey - Consumer behavior and preferences
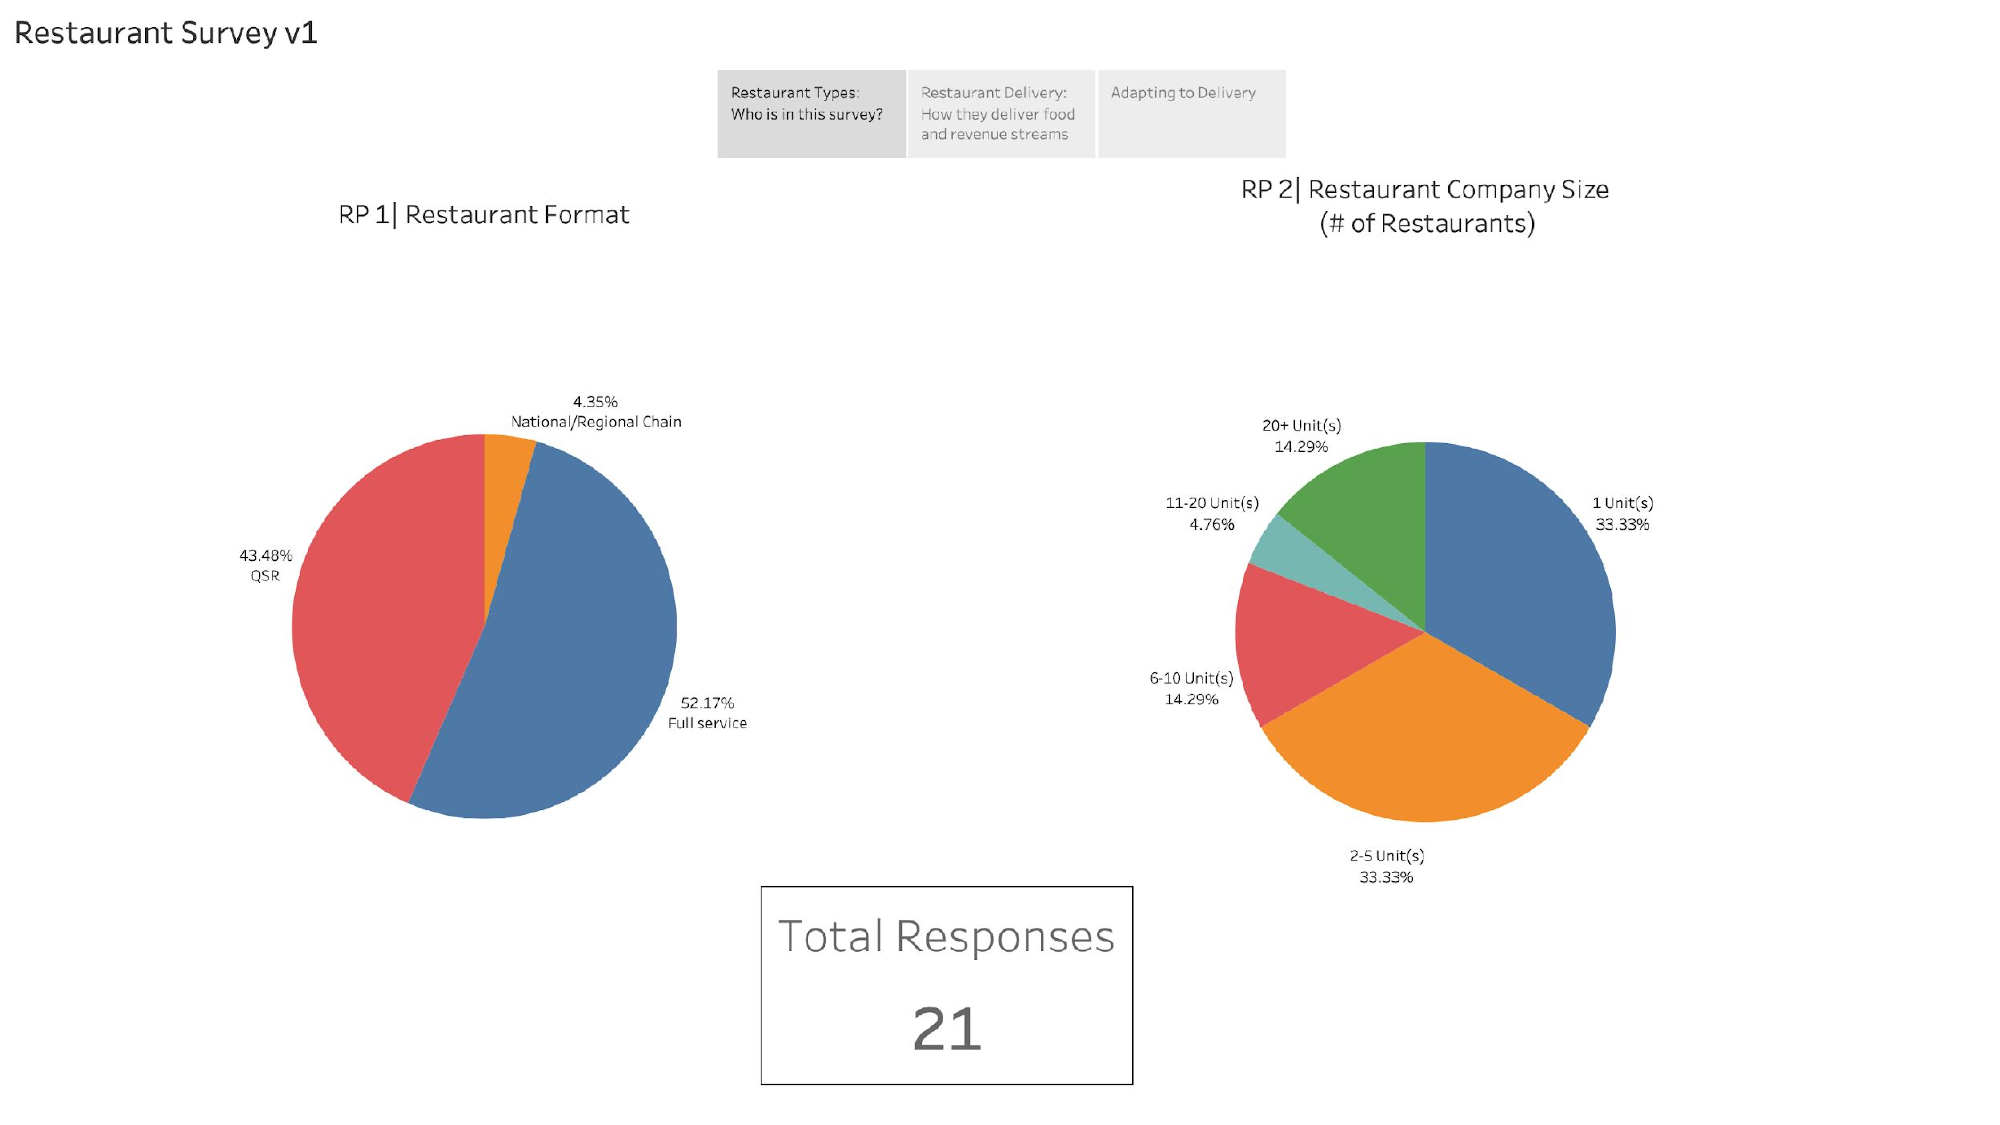
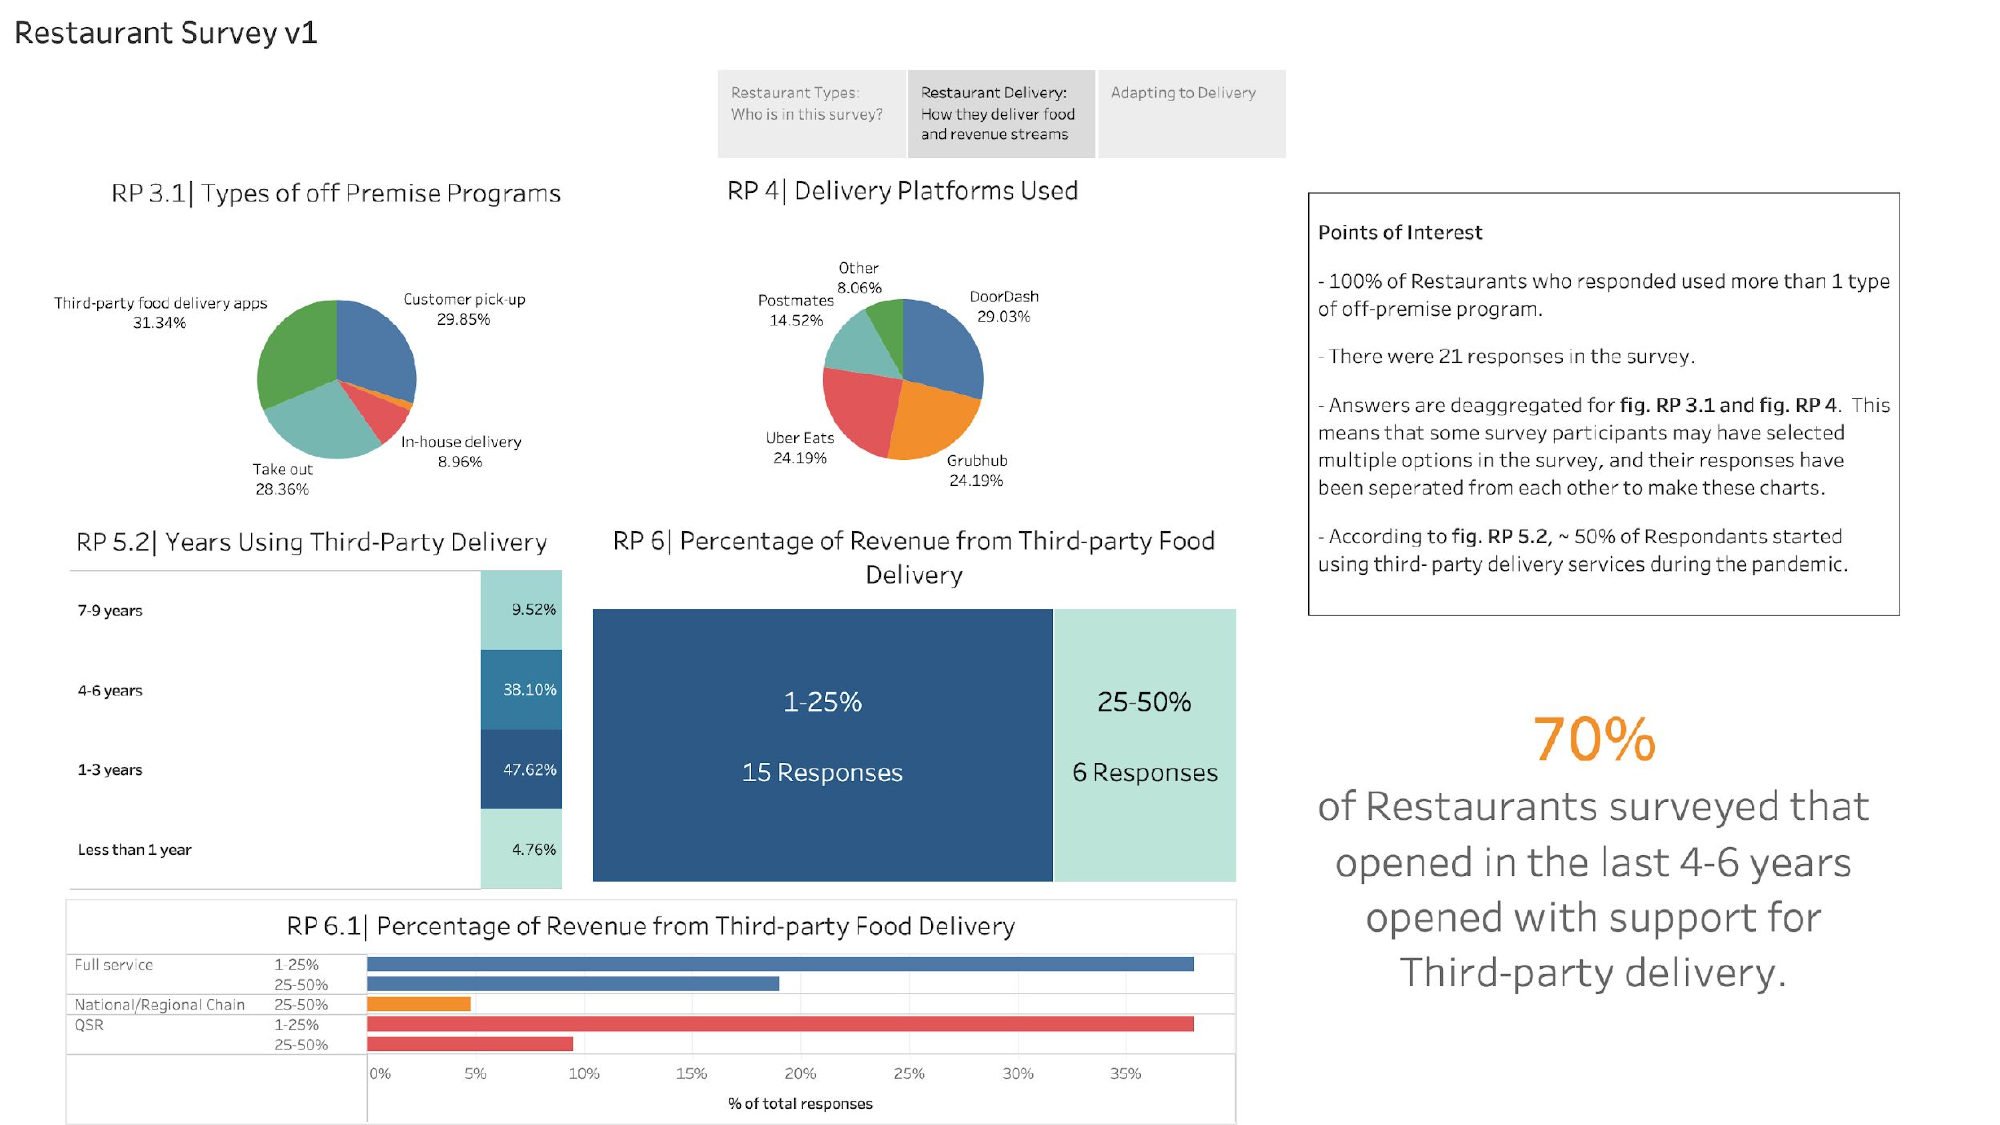
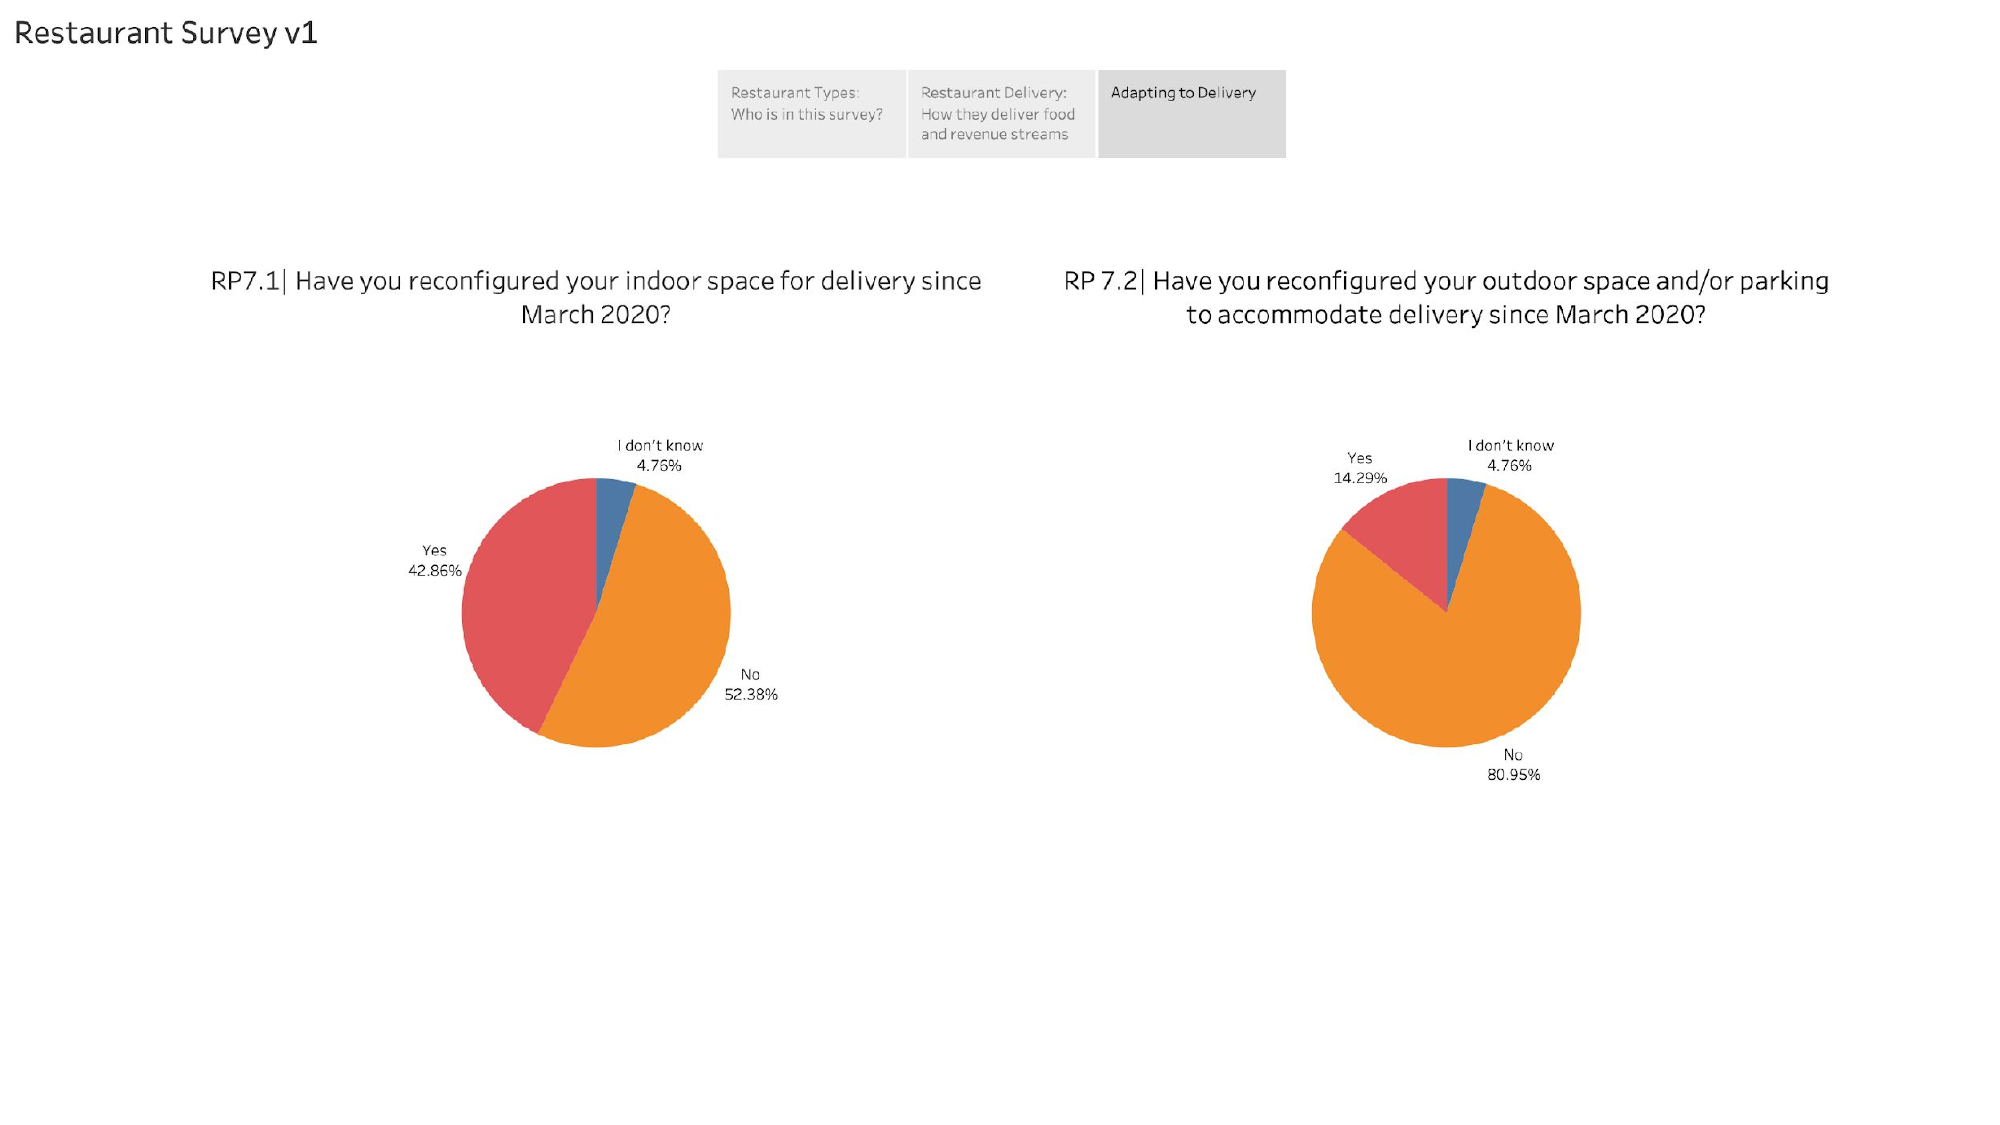
- Restaurant Survey - Impact on restaurant operations
Courier Survey

Customer Survey

Restaurant Survey